New Data Lab analysis shows government contract spending over time

Year-end spend is real. Any government contract watcher knows the concept, but seeing the data to prove it remains dramatic.
Over the past 10 years, the spike in agency contract spending in September, just before the end of the fiscal year, has accounted for between six and eight percent of the total spend that year. While no two year ends are exactly alike, the September spike in spending is a constant.
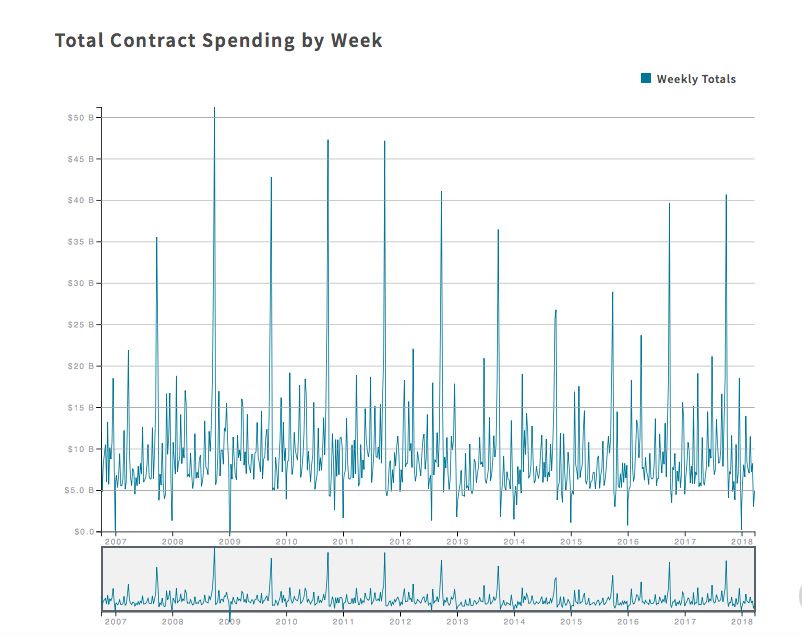
See those spikes? That’s September. (Screenshot)
This contracting trend and more are explored in a new data visualization posted in the Data Lab, a recent creation of the team behind USAspending.gov. The Data Lab, which launched in April, exists to help regular people explore and make sense of the vast data store that is USAspending.gov.
The point of this latest analysis is to offer users a tip on how the data can be used, said Justin Marisco, a senior analyst with the Fiscal Service. “Really what we’re trying to do in this analysis is come up with a research question or, like, a hypothesis, and test it,” Marisco said. “We want people in the research community to look to our dataset as an interesting and useful source of research about the federal government.”
The questions the team wanted to answer: How has federal contracting changed over time? And how did congressional appropriations impact federal contract spending?
To the first question, the team graphed year-over-year spending and isolated the aforementioned trend of year-end spend.
As to the second research question, what the team found is, essentially, that whether Congress passes a continuing resolution or a new appropriations bill does matter to contract spending patterns. For example, if Congress passes a continuing resolution, the data shows a significant spike in contract spending in the first week after the CR is passed. This doesn’t happen with a new appropriations bill.
The Data Lab team offers a possible explanation for this, drawn from a recent Government Accountability Office report in which “some agency officials reported delaying contracts and application times for grants while under a [continuing resolution].”
“If agencies are unable to issue new contracts because adequate funds are not available under continuing resolutions, needs accumulate, and then are satisfied once funding is available,” the analysis conclusion reads.
Marisco hopes that this analysis, beyond its own merits, will inspire people to come up with their own research questions. For example, which agencies are more or less affected by the current type of congressional appropriations bill? What’s the relationship between congressional appropriations and spending grants? And does a change in administration, or a new Congress, impact contract spending?
The Data Lab has also published a methodology white paper to help especially interested users dig deeper.
This latest visualization follows in the footsteps of others like a federal accounts dendrogram showing the nearly 2,000 federal bank accounts and a sunburst diagram looking at “how nearly $500 billion is spent each year on contracts.”